XeedMonitorMonitor what you need and know before the customer does
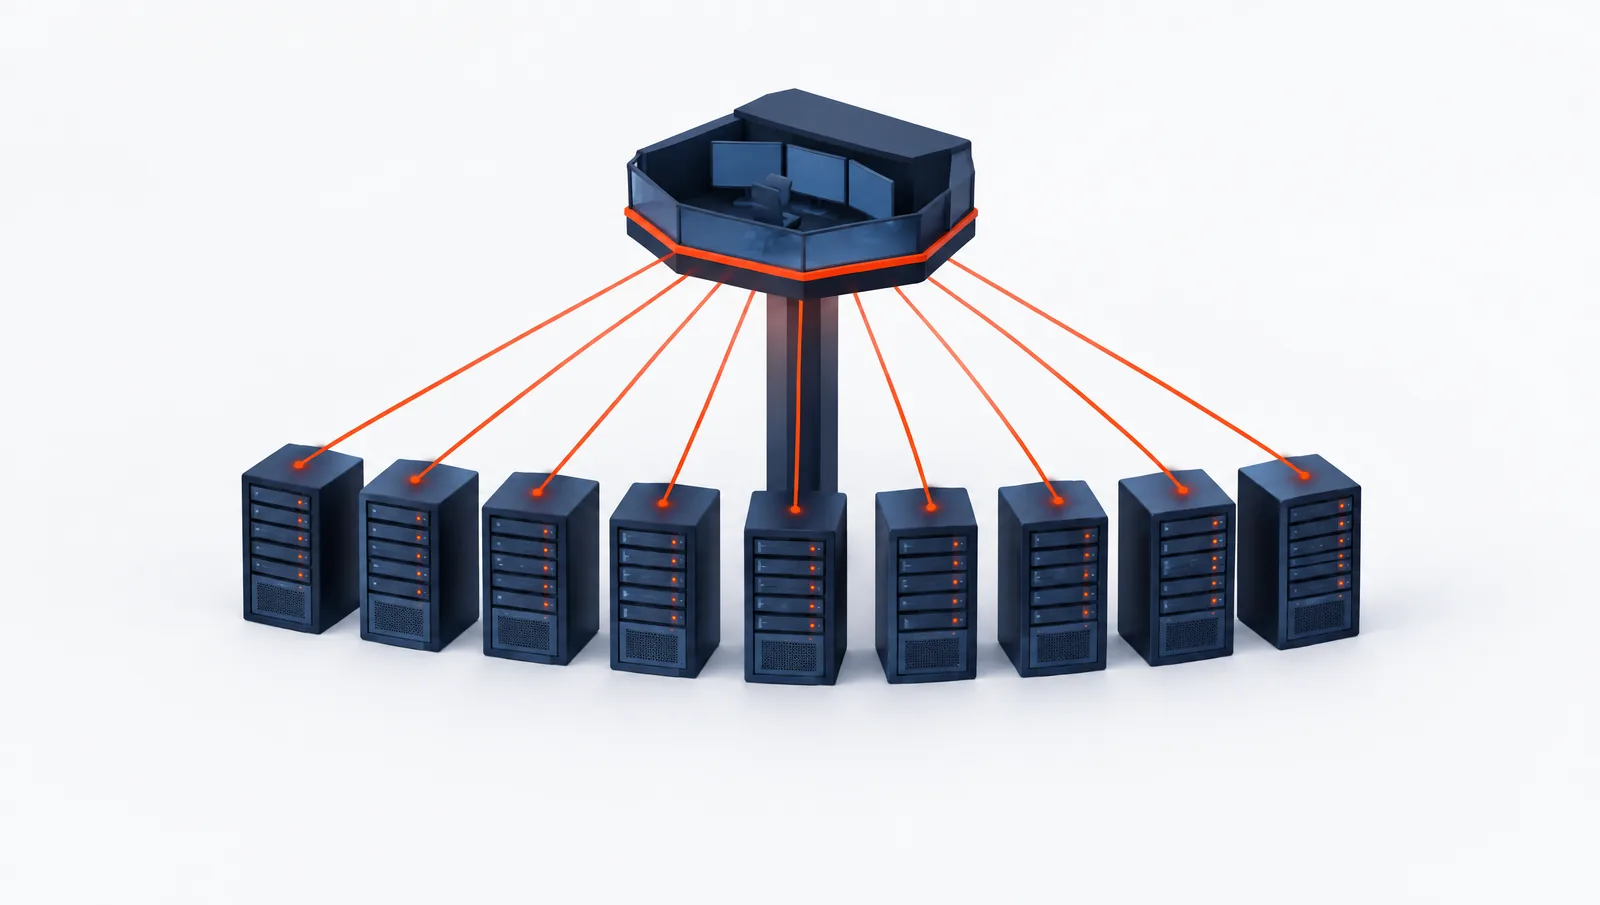
Watch sites, APIs, DNS, Linux/Windows servers, and whatever you mark as critical. A board with the health of each check and alerts when something stops responding — so you act before the complaint.
For people and companies that want to see the health of their services and know before the customer does.
What changes
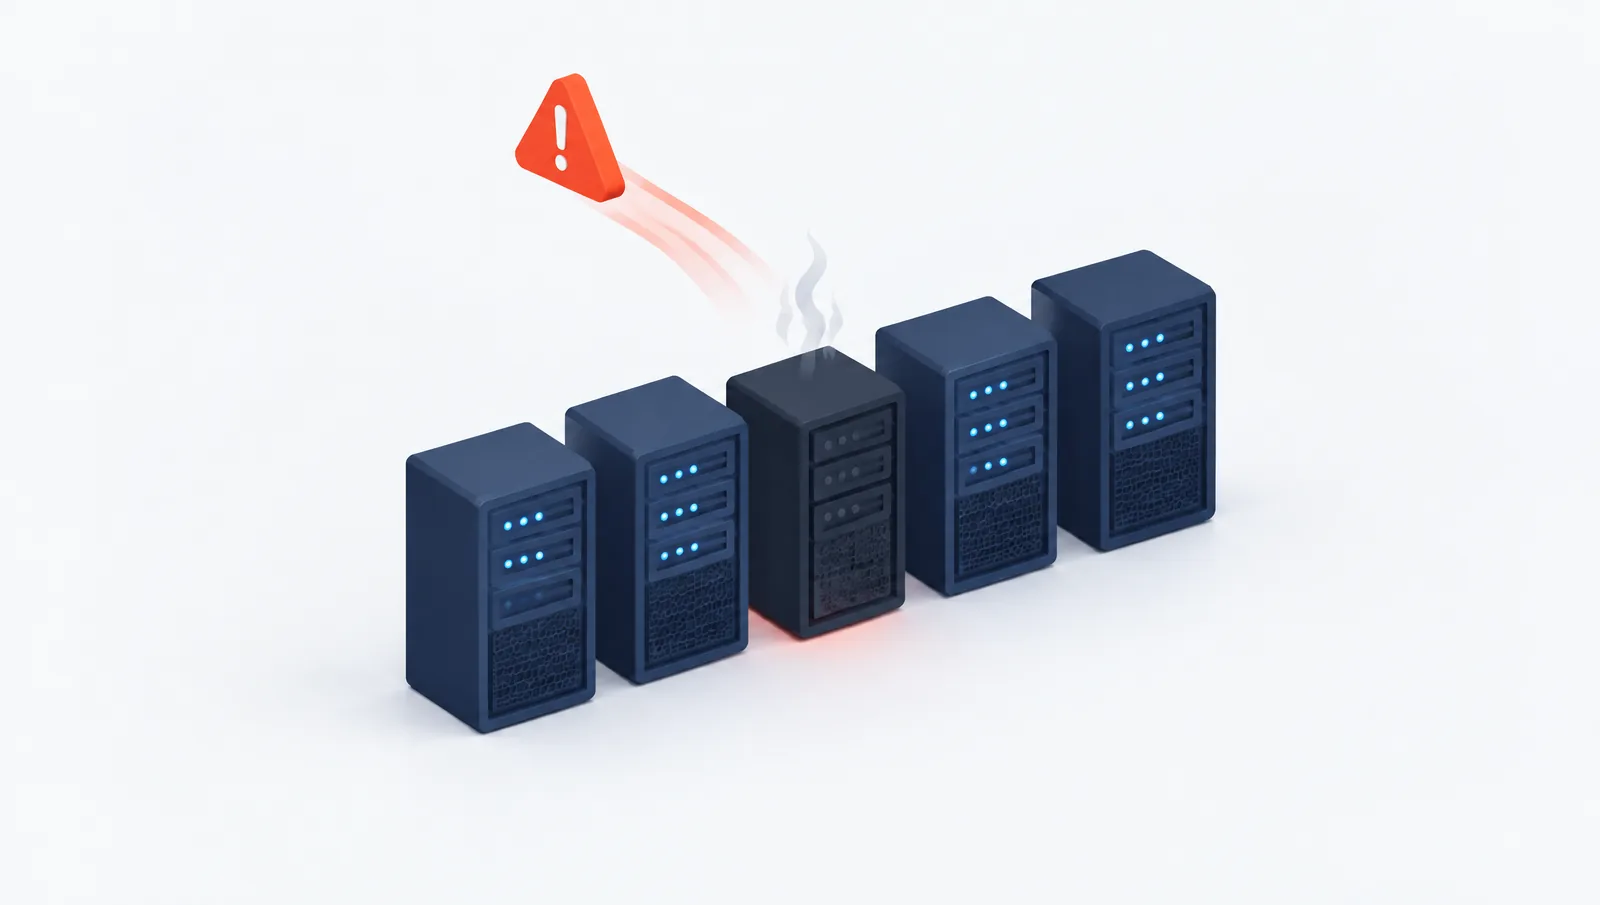
Something fails and the customer reports it first
Without a shared board, problems show up late: a slow site, a down API, or an expired certificate goes unnoticed until the complaint.

XeedMonitor
The health of what matters. On one board.
Monitor what your operation needs and know before the customer notices.
See how it worksBenefits
Why teams choose it
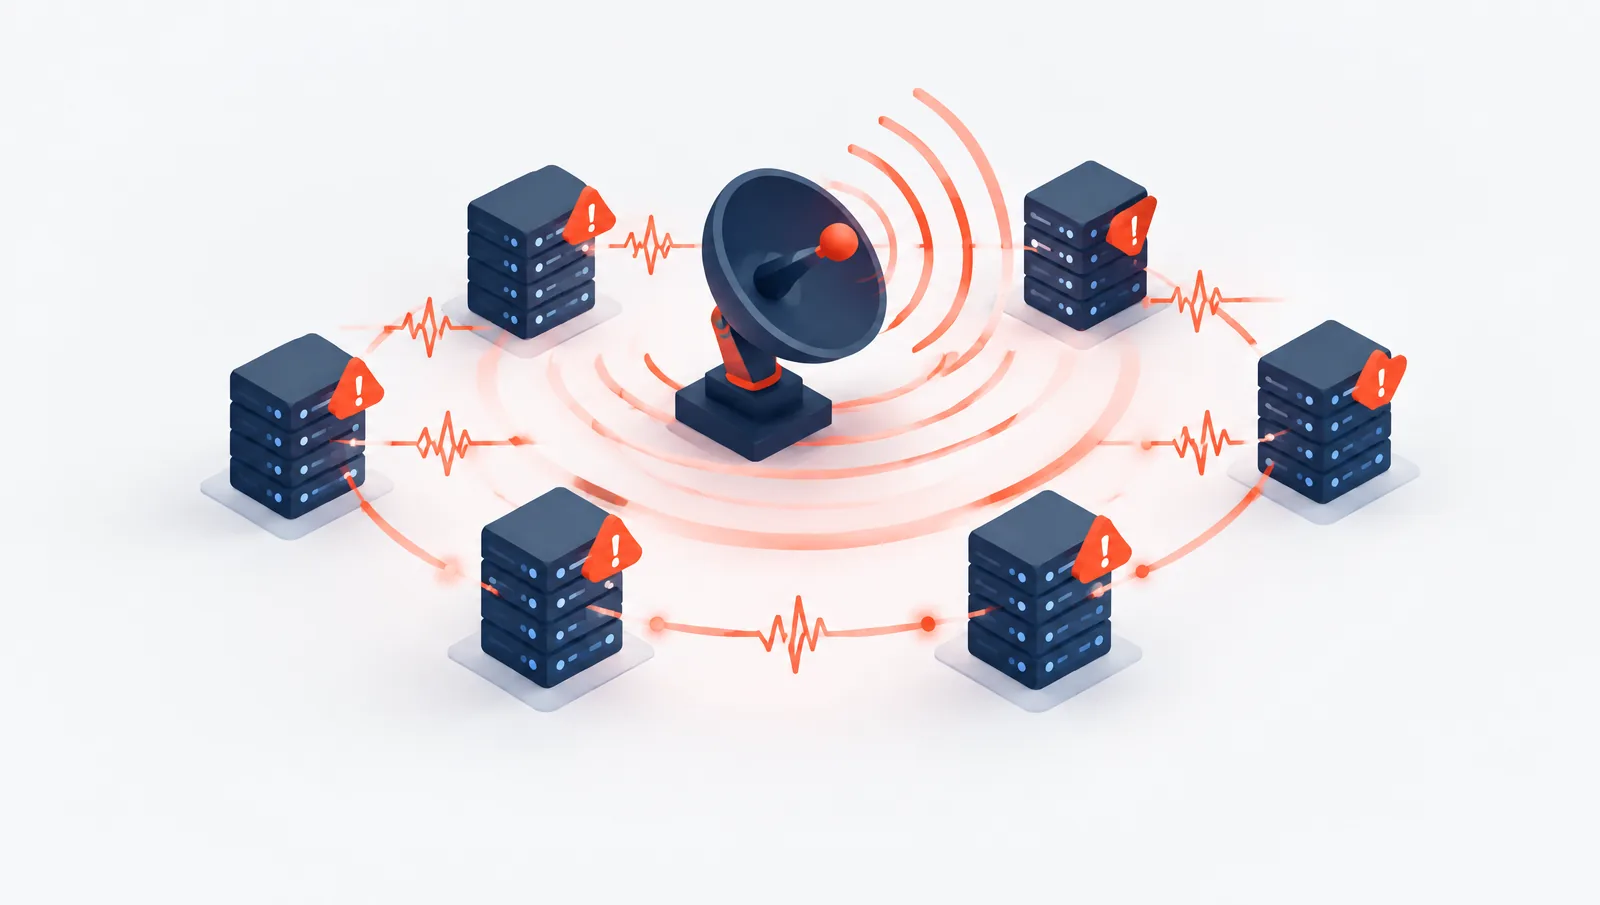
The notice arrives when a check stops responding, not when the user calls in.
It watches signals the team can act on, so every alert means real work.
Whatever you monitor — services, sites, or servers — on the same board.
Method
How it works
- Choose what to watch
A site, an API, a server, or the service that matters to your business.
- Set the criteria
Intervals, thresholds, and what counts as down or degraded.
- Get the alert
When a check fails, the notice arrives with the detail to act.
What it does
In short

Sites, endpoints, DNS, Linux or Windows servers, or your own services — you choose what joins the board.
Clear health per check: up, degraded, or down — no guessing or opening five panels.
Useful signals, not noise. Each alert says what failed and since when, on the channel you configure.
Who it is for
Typical cases
See at a glance what is up and what needs attention.
External and internal checks for what your business cannot afford to lose.
Include the infrastructure that holds up the service, not only the public URL.
Official site
Buy or try XeedMonitor
This page explains the product. Purchase and access live on the official site.
Official product site
View productTrust
Why trust this
It was designed on production services, not on a lab case.
It is not a fixed pack of checks: it monitors what your business marks as critical.
FAQ
Frequently asked questions
What can I monitor?
Sites, APIs, DNS, Linux/Windows servers, and other services you mark as critical for your operation.
How do I know if something fails?
With alerts on the channel you configure: the notice says which check failed and since when.
Does something have to be installed on each server?
For server checks, yes: a lightweight component reports to central control. External site or API checks do not require it.
Does it replace the monitoring I already have?
It can start with critical services and be compared with what you have before replacing it completely.
Shall we talk about your case?
Tell us which three services must not fail silently. We build the first monitoring view there.